

It’s graph time! I really love these graphs, since the lead histories for Hearts visually show some very interesting properties of the game! Given our statistical analysis of Hearts, let’s see how it scores on our heuristics of Order, Fairness, Convergence, Spread, Drama, and Security.
(See this previous post for a review of the heuristics I’ll be discussing.)
Order = 0.52
First up, our new heuristic, order. Here’s the graph again showing the win probability of the AI player when pitted against all random players.
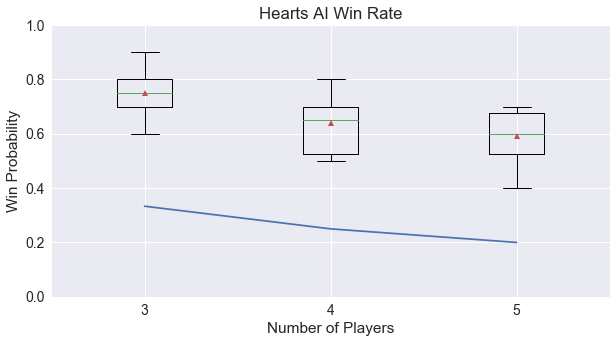
For the 4-player game, we’re able to win about 60% of the time, improving on the random expectation of 25%, which works out to a score of 0.48. Compared to the other games analyzed, this is higher than Agram, about equal to Stealing Bundles, and lower than both Ninety-Eight and Pairs, which matches my intuition about creating the heuristic.
Fairness = 0.86
With random players, we find that Hearts is a relatively fair game, scoring close to the expected value for 4 players.
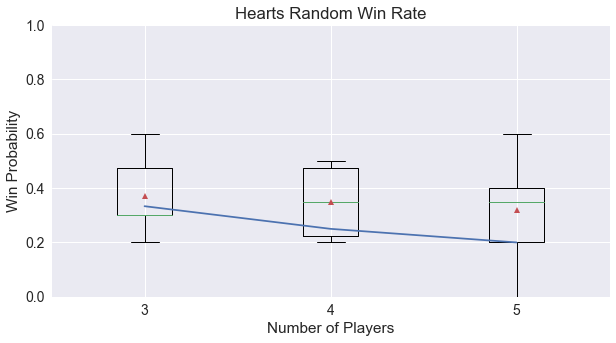
However, we see that for 5 players, the first-player wins more often than expected. This is most likely due to the limited number of Hearts in the game, which make it more likely that players will be able to avoid taking any, thus scoring the least for first place. I would expect this rising trend to continue if Hearts were extended to a 6-player game.
Convergence = 0.54
To show convergence, which captures how much the game trends toward less choices at the end of the game than at the beginning, we graph here the number of choices for each player for all 100 games and each regression line found. The choices are shown overlapping, where darker blue circles mean that more games were found to have this exact number of choices for at this point in the game.
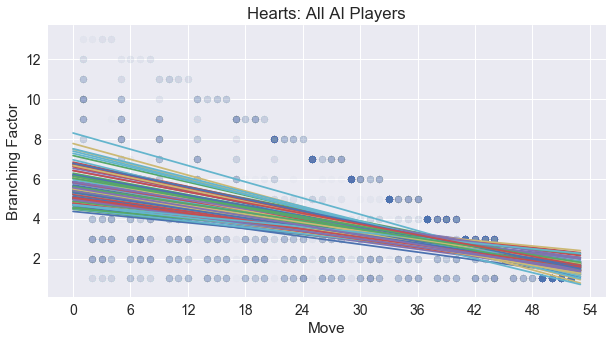
There is a definite convergence toward the end of the game, however, the slope is decreased because of the earlier seen effect of the Hearts suit not being broken until around the fourth or fifth turn of the game.
Spread = 0.14
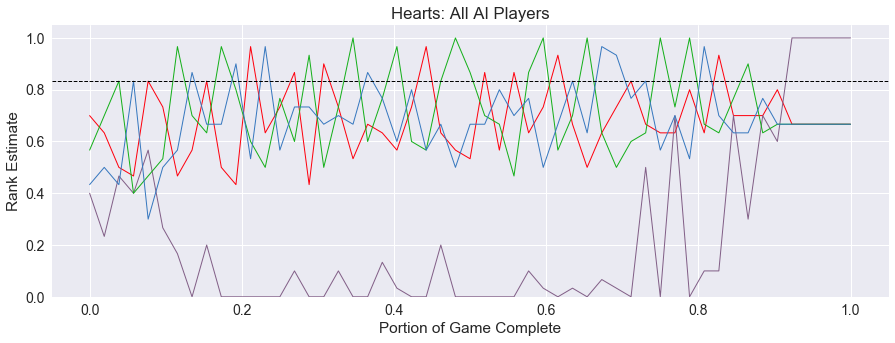
Now for the lead histories! First, here we see a typical game of Hearts played out with four AI players. Let’s see what we can notice visually from this graph.
The game starts out with all players believing they are doing OK, but at around one-third of the way through, one player’s estimate is consistently low, with very little or no chance of success. What happened here?
At this point in the game, the blue player won a trick containing the Queen of Spades! With this card conveying 13 points to the player who wins it, this becomes an insurmountable penalty. The other players become even more confident in their positions of winning, until the rest of the Hearts cards play out and their scores are settled.
This settling of scores after two-thirds of the game is complete is a large contributor to Hearts earning a low spread score. There are definite points in the game where a player will see a broad spectrum of choices, but much of the time, a player’s path seems determined (stuck at the bottom) and therefore uninteresting.
Drama = 0.46
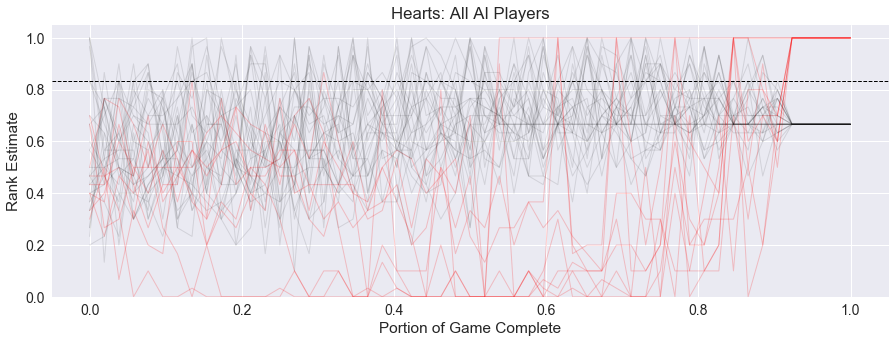
However, a static trajectory is not always the case. Below is another lead history graph. Can you determine what happened in this game?
This game of Hearts starts out similar to our previous game, with one player taking the Queen of Spades at around the one-fifth point in the game, spelling doom for their chances of winning. But wait. Could it be? Yes! The purple player collected all of the penalty cards to Shoot the Moon and win the game!
This is what a dramatic game looks like, with the winner underwater for most of the game and coming back at the end, pulling it off in the last trick. And, none of the other players believe this is going to happen, consistently estimating the purple player’s chances of winning very low.
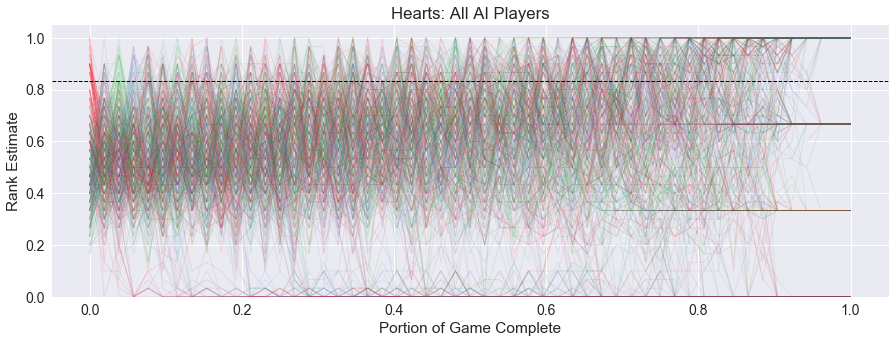
In fact, this happens in 9% of our simulations of games with all AI players! Here is the aggregate graph of these games where the winning player shot the moon, with the winning player shown in red.
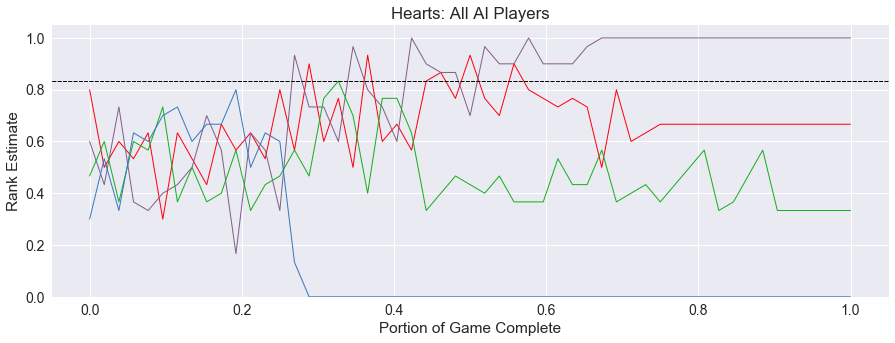
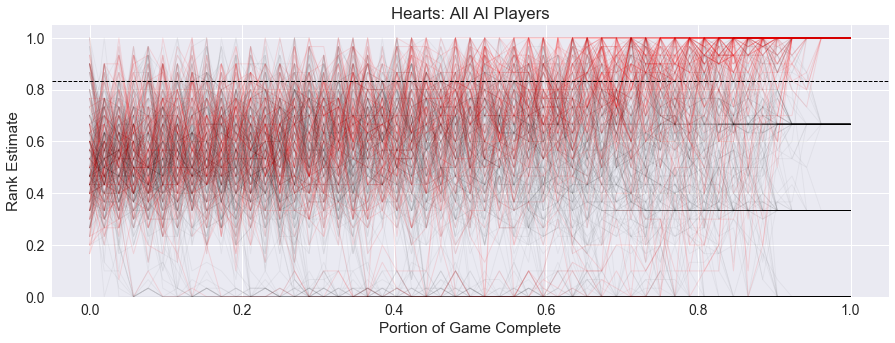
But at only 9% of the games being so dramatic, the other 91% show a more stable game with consistently high estimates for the winner, bringing the overall drama score down to 0.46. The graph below shows the lead histories for all 100 simulations with all AI players.
One other interesting point: in simulations with only one AI player, where the rest are random, we see that the AI rarely shoots the moon. The following graph shows these lead histories. These are more consistent due to them being just from the perspective of one player.
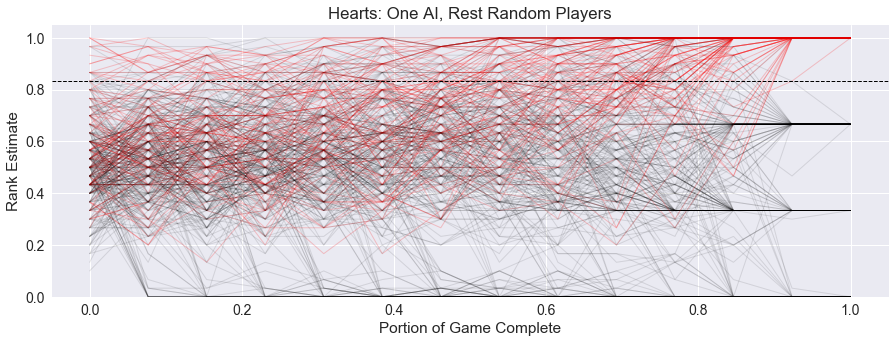
It appears that random players are much more likely to destroy the shoot the moon strategy by picking up a Heart card by accident, whereas the AI players mostly try to avoid taking any Hearts at all.
Security = 0.34
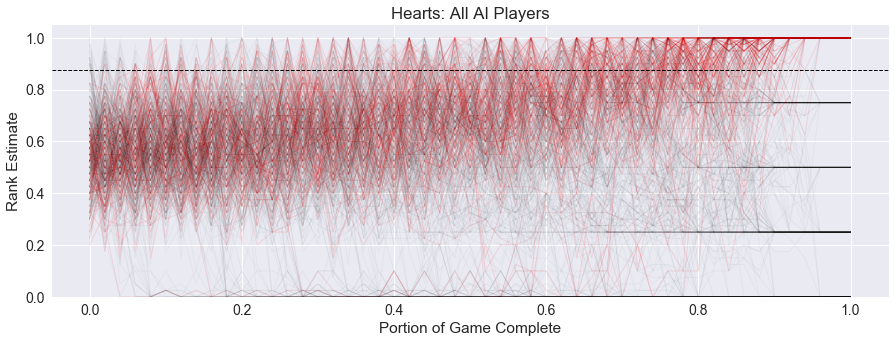
Again, since most of the simulations show the winning player performing well, the security of Hearts is somewhat high at 0.34. The graph below again shows the aggregate lead histories for all AI player simulations, with the winner shown in red, while all other players are in black.
Note the dark bands that start to show up for players in the latter half of the game. The trajectory for the player with the worst score solidifies first, followed by the next lowest, and finally the top two positions are determined. This helps increase the security of the game, and contributes to the low spread found earlier.
For completeness, here is the three player graph:
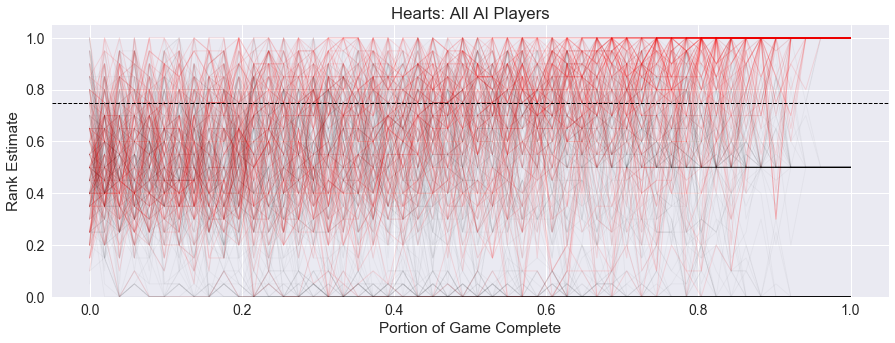
and the five-player graph:
Each of these graphs for Hearts show the slow drop-off of players to losing positions and the consistently rising trend across the remaining player estimates, which is especially pronounced in the five-player game.
One last thing we can see in these graphs is the effect of turn order on the win estimates. When looking at the five-player game above, we see that the estimates are almost completely consistent at the start of the trick for the last few tricks of the game. Note the way the graphs converge at when 80% of the game is complete, this is when the lead player makes their move and estimates. And again at 90% of the game, the graphs converge again, and mostly stay consistent to the end of the game.
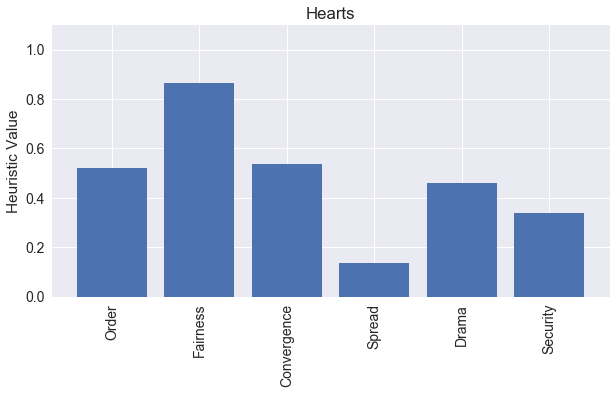
Summary
Here is our summary graph of all the heuristics for Hearts, showing visually the low spread and high fairness.
So, can we conclude that 9% of the time in Hearts, a player will shoot the moon? Not exactly. It is worth noting that this estimate of 9% is based on the current weak AI model used in our CardStock simulations, which makes no assumptions about the intelligence of the other players when deciding on a move. More advanced AI players may be able to detect the Shoot the Moon strategy being attempted and thwart it by sacrificing a few points.
Up Next - Variants
Now that we have established some trends for Hearts, we can use it as a baseline for comparison to some well-known variants. We’ll be simulating Black Maria, which does not include the breaking-Hearts rule, Knaves, where only the four Jacks win points instead of all 13 hearts, Polignac, like Knaves but with another penalty for the first and last trick, and SlobberHannes, where only one card should be avoided, plus the first and last trick. I’m also adding in the Jack of Diamonds variant based on a recommendation comment (thanks P.D. Magnus!) in my previous post.
I’m looking forward to seeing how these variants change the game, let me know if you have any other suggestions for analysis, thanks again for reading!
comments powered by Disqus