

Before we dive into more details on Agram, I thought it would help to step back and talk about heuristics. If we want to know how it feels to play the game, what kind of decisions a player is going to have to make, we’ll need to quantify these characteristics with numbers. This is known as using heuristics, capturing something complicated with a simplified view.
To analyze card games, we’ll be using a number of different heuristic formula, each of which is designed to capture a unique aspect of the game. These heuristics are adapted from work by Cameron Browne on Evolutionary Game Design and Evaluation. Each heuristic is calculated on a 0-1 scale, with 0 being no evidence of this quality, and 1 being full evidence. To start off, we’ll look at five for each game, Fairness, Convergence, Spread, Drama, and Security.
Fairness
First, we calculate the fairness of the game from the perspective of the first player.
We record the win percentage (wp) in games with all RandomPlayer AIs for the first player.
Next, we determine how close this is to the expected win percentage (ewp) for the number of
players in the game (np). For example, with 4 players, a fair game would have the first player
win 25% of the time.
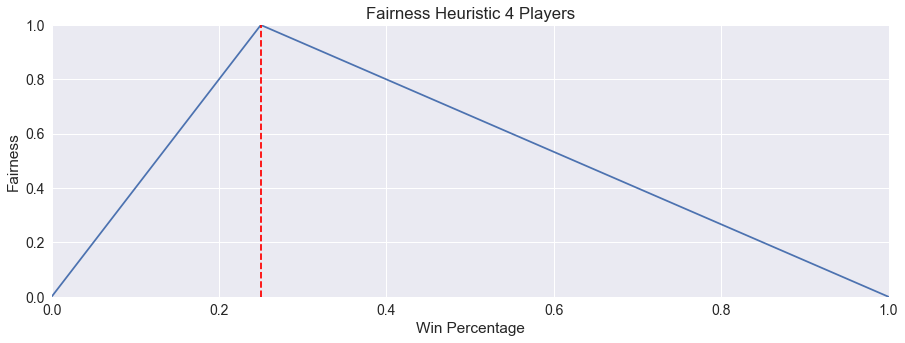
If the win percentage is less than or equal to the expected value, we calculate Fairness using the following formula:
\[Fairness = wp * np\]Otherwise, we need to scale the opposite way:
\[Fairness = (\frac{-np}{np - 1} * wp) + \frac{np}{np - 1}\]This is illustrated in the picture below, again for a 4 player game.
Convergence
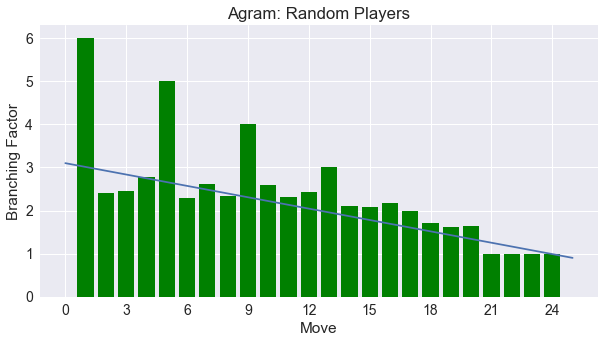
One common trait we see in games is an abundance of choices in the beginning and then tapering off to a limited number of choices near the end. Trick-taking games exemplify this quality, where after each trick is played you have one card in your hand. The moves become increasingly tighter, and we can definitely see this trend in Agram, as shown in the following image.
However, this is not a universally desired trait. Some games that I hope to discuss later, such as Pairs or Blackjack have the same number of options per turn, while others like Dominion or San Juan see the player choices expand as the game progresses in a snowballing effect.
To quantify this as a heuristic, we can calculate the slope of the line from linear regression for each individual game. We convert this into a 0-1 scale through the following formula:
\[Convergence = (1 - (\frac{slope}{2} + 0.5))\]We then average these individual convergence scores across all games to calculate the total convergence heuristic.
Spread
When deciding which move to make, an AI will try to determine their chances of winning for each given move. As a player looks at their possible moves in the game, many times they can identify some moves quickly as good and others as bad. Other times, it is difficult to know which move will have the best outcomes. For the next three heuristics, we look at how quantify the effect these differences have on the player’s game experience.
If there is a difference in the win percentage estimates between possible moves, then this is a meaningful choice for the player: they should choose the move that gives them the best estimate. If there is no difference, then for all intents and purposes, the move is meaningless.
By subtracting the minimum estimate from the maximum estimate (which will ultimately be chosen by the player) at each turn, we can calculate the spread (s) between these moves. Since a game is a series of interesting decisions, we want there to be consistently high spread throughout the whole game. If we define the number of choices a player has in the game as numc and the variance at a certain choice as vari, then we can determine the degree to which a player has meaningful moves by:
\[Spread = \frac{\sum_{i=1}^{numc}{s_i}}{numc}\]Drama
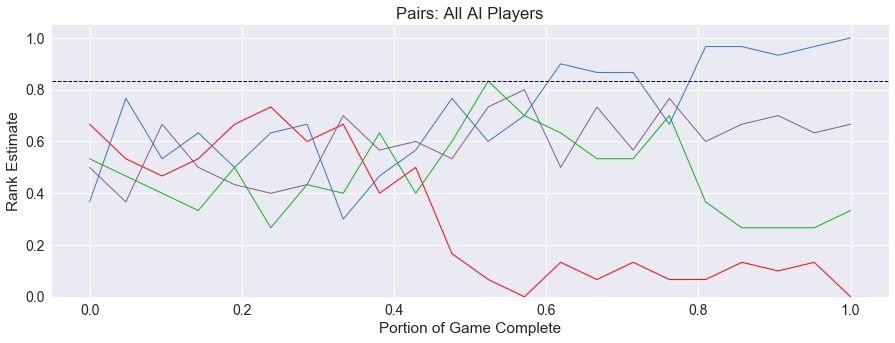
To really get a picture of the shape and flow of the game play (and thus the name of the blog), we can record the move estimates for all players each time an AI player need to make a decision. These recordings are known as lead histories. A record of lead history will have two dimensions, the number of players (np), and the number of moves in the game.
For example, the below image shows the AI estimates of player rank in a 4 player game, with 1 being the highest rank, and 0 being the lowest rank. In the beginning of the game, most players are in the middle with a good chance of winning. However, we can see for the one player, shown in red, there is a critical point about half-way through the game where they fumble and can never recover.
There are many heuristics we can calculate using these lead histories, and we will introduce more as the blog proceeds. Our first heuristic discussed here is Drama.
When is a card game dramatic? If a player can come from behind and eventually win the game, this is a dramatic event, whereas if the winning player does not have to exert much effort in the game to maintain their lead, the drama is diminished. Large swings in the player rankings indicate high drama. We define drama here as the average severity of being in a trailing postion for the eventual winner.
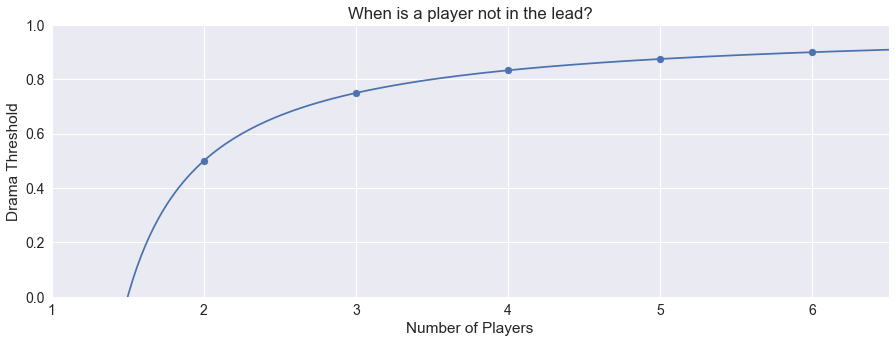
Formally, we first need to define a threshold for drama. In a two-player game, the threshold should be 0.5, half-way in-between the winning and losing ranks. But what about games with multiple players? We can adapt this idea of half-way in-between to be between the top ranked player and the next highest rank, so that when a player estimates their rank above the threshold, they believe it is more likely than not that they will be the winner of the game. We call this drama threshold dthresh.
\[dthresh = \frac{1 + (\frac{np - 2}{np - 1})}{2}\]In the image below, we see that for two players, this equation equals 0.5 as we hoped. For more players, the threshold rises slowly to account for the increase in rank for the second-highest player.
The full Drama heuristic is then calculated using the winning player’s path through the lead history. The number of times the leader is below the threshold is dcount. Each time their estimate falls below the drama threshold, the difference between the threshold and the estimate is calculated, and the sum of these differences is averaged. These differences are also scaled by taking the square root, so that larger differences weighted more heavily in the final average.
\[Drama = \frac{\sum_{i=1}^{dcount}\sqrt{dthresh - est[winner][i]}}{dcount}\]Security
One other calculation we could make related to drama is the notion of the lead security of the winning player. A simple way to determine security is the percentage of the game that the winner was in the lead in the game. Other heuristics later will refine this notion, but this will get us started. Using dcount from above, and dividing by the total number of moves in the game gives us the following equation.
\[Security = 1 - \frac{dcount}{moves}\]Capturing Gameplay Emotions
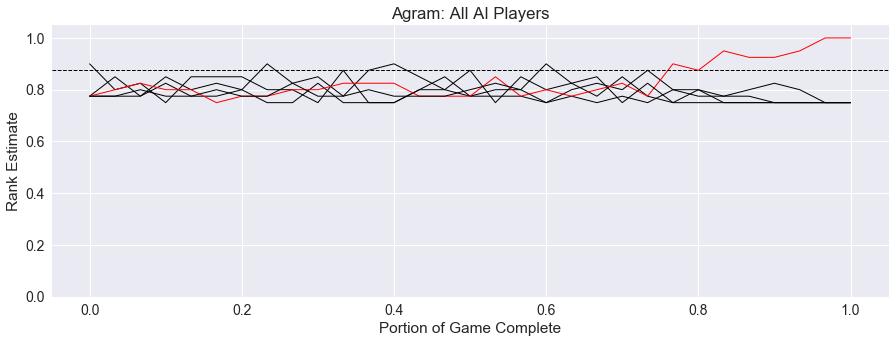
So, do these capture our intuition about drama and security? Let’s look at two sample game runs to see where we can find drama. In each of these pictures, the winning player is denoted in red, and the drama threshold is the horizontal blue dashed line.
First, we have a three-player game, where the winning player dips below the drama threshold only three times. In these dips, they are very close to the threshold, so this game has very low drama, and high security.
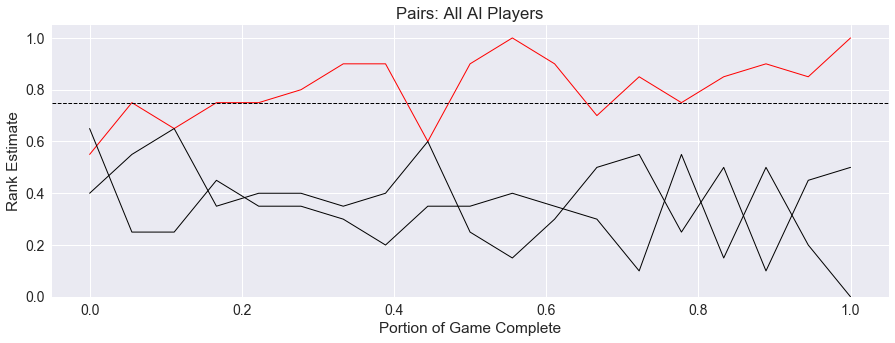
Second, in a five-player game, the lead is undecided for a while, lowering the security. Also, when the winner was below the threshold, they were far below, increasing the drama present in the game.
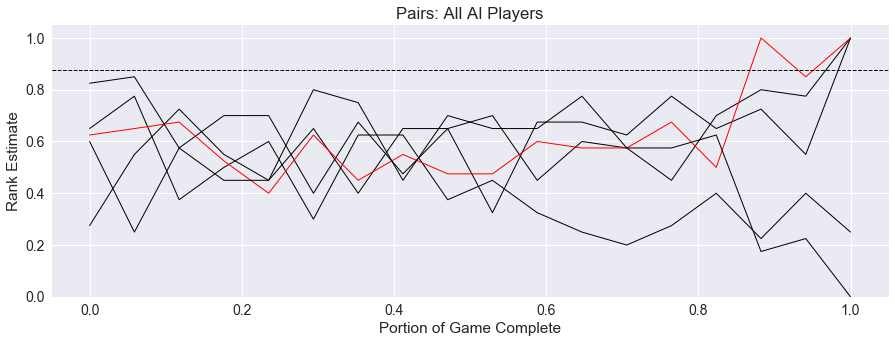
Finally, we see different five-player game that exhibits both drama and low security. The winner of the game is not determined until the latter half of the game, and most players believe themselves to be near the threshold to win.
Conclusion
The final graph above is from Agram, and we will dive into more details about what we see here in the next post. Using all five of these heuristics, we will start to see how it feels to be a player of Agram, and later, how quantifying this experience helps us determine the similarity of Agram to other games.
comments powered by Disqus