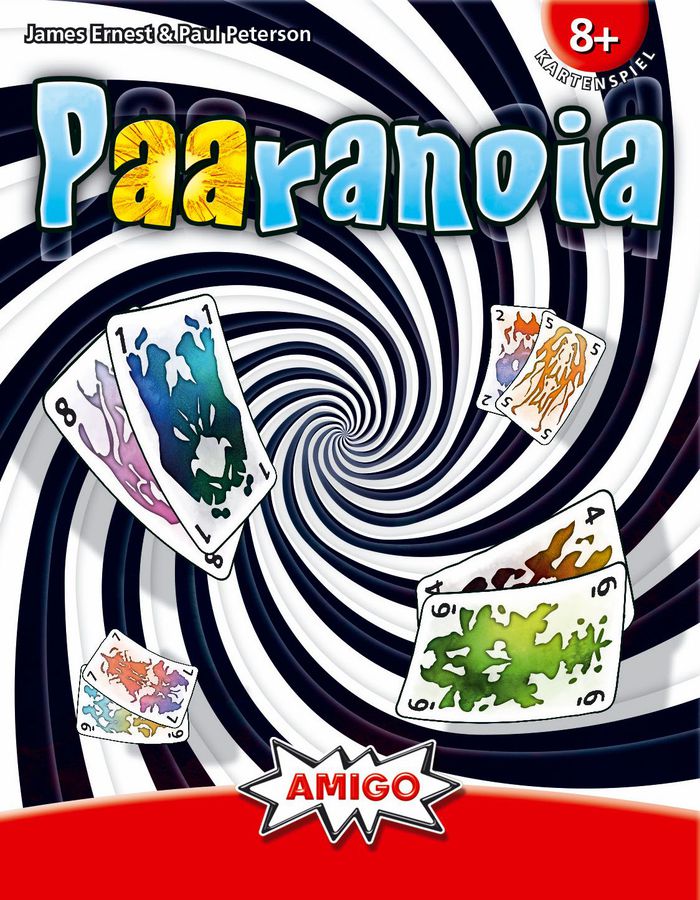
It’s been a month since the last post (I’m slowly realizing this will blog not be as regular as I hoped) but some of my other work is wrapping up, so time for more card game analysis!
Now that we’ve seen some basic statistics for Pairs, let’s see how it scores on our heuristics of Fairness, Convergence, Spread, Drama, and Security. (See this previous post for a review of the heuristics I’ll be discussing.)
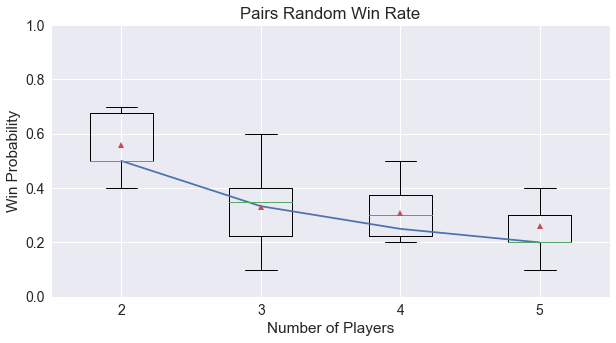
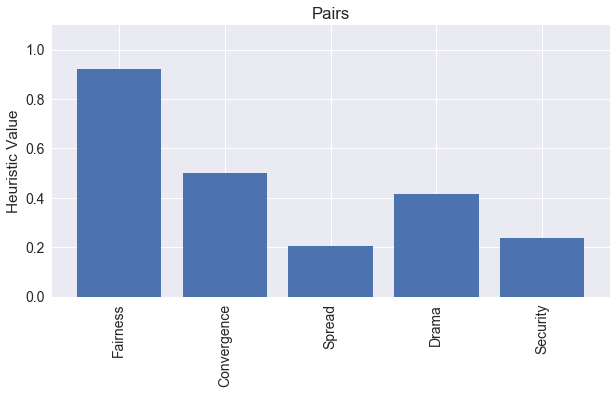
Fairness = 0.92
The graph here shows a box plot of the first player’s win rate from 2 to 5 players, with the blue line showing the expected win rate for an average player. It looks like Pairs is overall a very fair game! In previous work, we looked at how the rule that the player with the lowest card goes first mitigates some, but not all, of the turn-order bias. But, since the first player is decided after the cards have been dealt each round, then any internal bias is averaged out across all players.
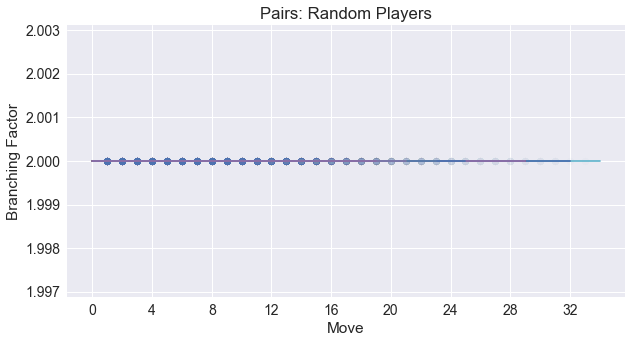
Convergence = 0.5
Pairs players always have two choices, either to press on for another card, or take the lowest visible card and cut their losses. Therefore, convergence is rather uninteresting with a perfectly flat slope. Moving on …
Spread = 0.21
Recall that spread is the average difference between the minimum and maximum win estimates that a player estimates for themselves throughout the game. If this is high, then it is evidence that the player is making interesting decisions.
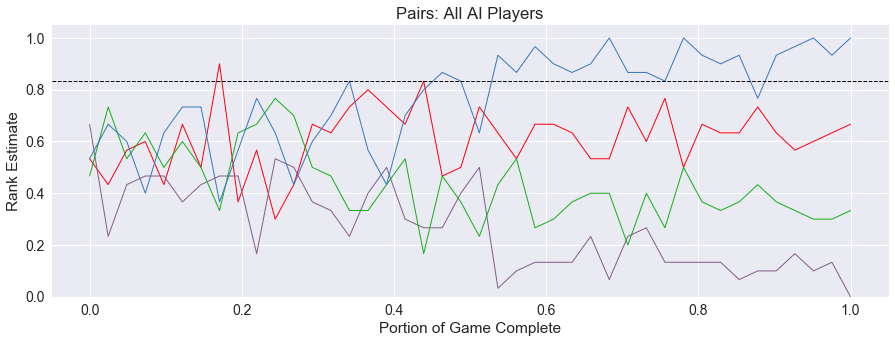
The spread of scores for Pairs is much larger than we saw in Agram. First, we have a good way to separate the players into ranks depending on their total points at the end of the game. And as you can see from the lead history below for a four-player game, there’s a fair amount of movement in the ranks as the game progresses.
Drama = 0.41
Looking at the above picture, the drama of Pairs appears to be low, with the player in blue confident in their victory after 50% of the game has been played. However, other lead histories show a different story, as shown below.
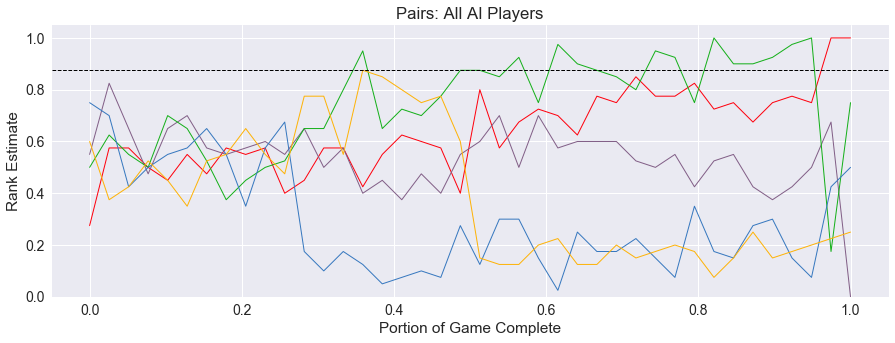
What a tense game! Blue takes a hit early and never gets back in the game. Yellow appears to be coasting to victory after Blue takes a hit, followed quickly by Green. But nothing is certain, and at around the midpoint of the game, Yellow takes on points, letting Green regain the lead in the final rounds. And, the ultimate winner is Red, who has been lurking in the background the whole game! With such large swings below the blue dotted drama threshold, we can see why this heuristic is much higher than Agram.
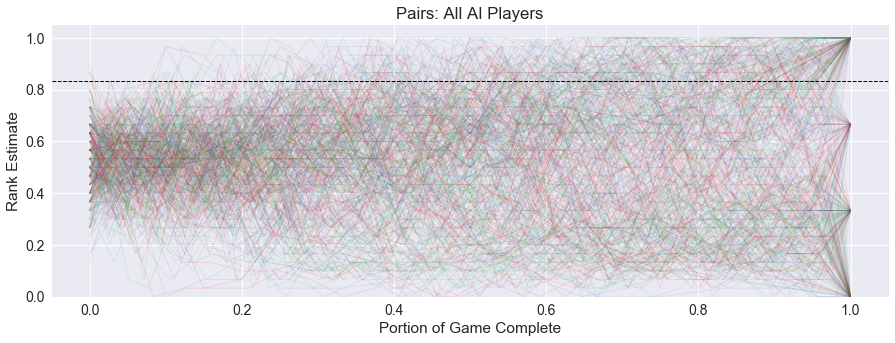
The graph below shows the aggregate of 100 games of Pairs with AI players. It appears that players start out thinking they can avoid losing the game. Each time a player takes points, they fall drastically in the rankings. Sometimes they recover, but its a slow crawl back up, and more often than not, they stay in the lower half of the graph until the end of the game.
Security = 0.24
When we shade the lead histories with the winner in red and the other players in black, we can see that the drama is mostly in the first half of the game. Here is the graph for the four-player games.
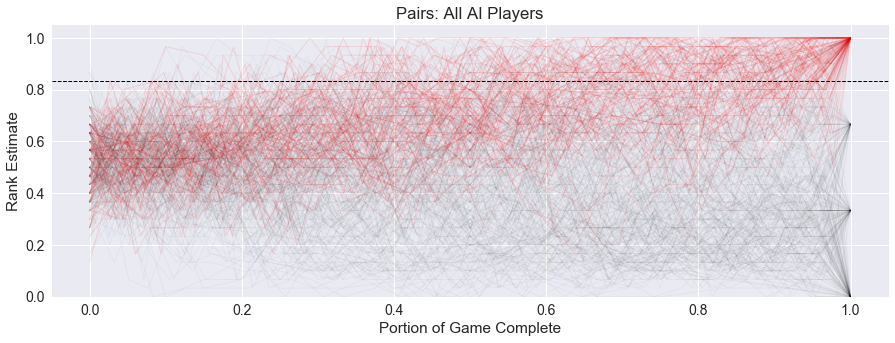
The real fight in Pairs is to not lose the game, once you’ve taken a hit, the recovery is slow. This leads to a moderate score for security, which is the percentage of the game the winning player is above the drama threshold.
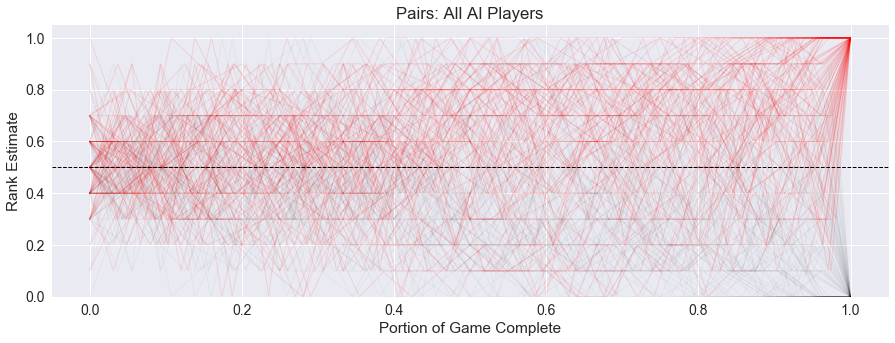
For completeness, here is the two-player graph:
The three-player graph:
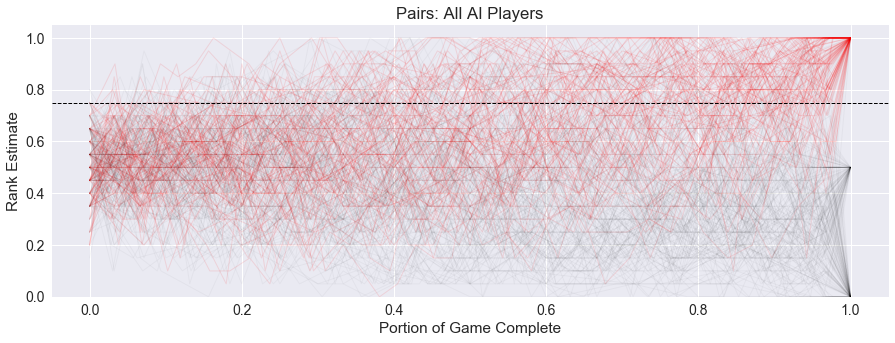
And the five-player graph:
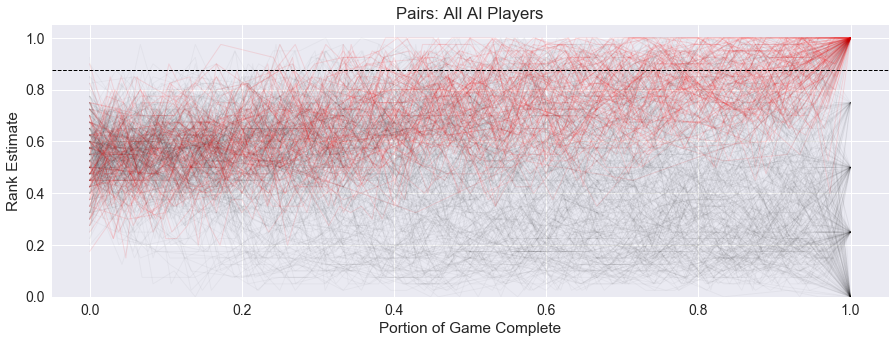
Summary
Here is a graph of all five heuristics for the four-player version of Pairs. Except for convergence, each of these scores is higher than Agram. But that’s not necessarily a good thing. We want some security in a game, but is 50% too high and becoming boring? Is a high-drama game too random for many players? These numbers tell us about the shape of the game, and hopefully can be used to help people select games that match their preferences.
Does this analysis track with your experience with Pairs? Are there other games you’d like to see analyzed? I’d love to hear your thoughts below! In the syndication of this blog on boardgamegeek.com, Someone posted that their favorite way to play Pairs was with the Port variant of the Pirate Deck. I’ll be making a future post on game variants, where I’ll definitely discuss this along with the Calamities and Continuous variants. Also, from another suggestion, I’ve replaced some of my previous bar charts and error bars with box plots, to give a better picture of the distributions, as well as avoid calculating error bars that impossibly go beyond 100%. Thanks for the comments!
Up Next - Ninety-Eight
Our next game genre will be an Adder, where you add card values of cards played, trying to reach or avoid a certain total. The simplest game of this genre is Ninety-Eight, and its mechanics are at the core of commercial games such as O’NO 99, BOOMO, and 5 Alive.
Give the rules a try, and I’ll walk through the RECYCLE coding for Ninety-Eight next!
(Image courtesy of BoardGameGeek)
comments powered by Disqus

