I’m working on a panel proposal for SIGCSE 2019 with the topic of “Civic Engagement Across the Computing Curriculum.” I sent out an email to the SIGCSE mailing list asking for interested volunteers to join me, and I was overwhelmed by 15 excited replies. Because of limited time in the panel (75 minutes) and limited space in the proceedings (2 pages) I could only accept 4 other panelists, but we are attempting to make our proposal very engaging and inclusive of the audience to allow for everyone’s voice to be heard. The deadline for panel submissions is Friday, so we are hard at work revising and trimming our statements to fit the submission constraints.
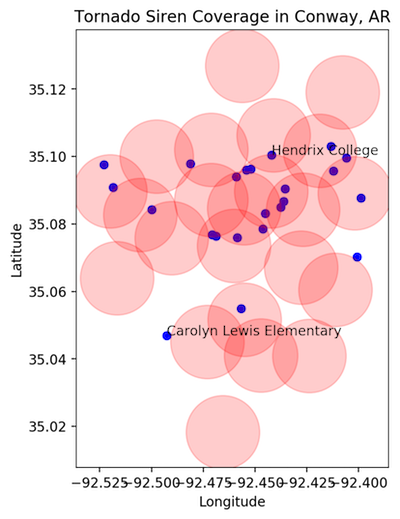
One of the topics I mention in my position statement is a Civic Hacking lab that I developed last fall for our CS1 course. The city of Conway has multiple datasets about the city available for download. Our assignment had the students combine the location data for schools and tornado sirens to visualize the coverage of tornado warnings, with the following image as the eventual goal of the lab.
I’ve spent some time this week revising this lab, inspired by another SIGCSE mailing list post on methods to incorporate Jupyter Notebooks into a course without requiring students to install any software. One of the solutions that piqued my interest was MyBinder, where you provide the url of a notebook available on GitHub, and it is wrapped up with a virtual environment to be available for students to explore and process. I’m hoping this fixes some of the problems we encountered in the lab, where students were stumbling over setting up the CoCalc environment and subsequently losing their data because of our freeware version losing priority. With a template notebook provided, I think they would make much more progress in the lab. It would be great if I can get this ready for this fall’s course and get more student reflection experiences.
I also managed to refresh the plotting section with a smoother heatmap of siren coverage, and incorporate the city boundary polygon using GeoPandas, descartes, and some tutorial help.
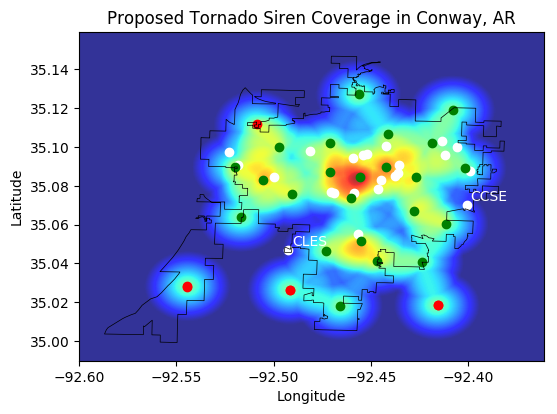
The schools are plotted in white, the current siren locations are green, and the proposed new sirens are in red. We can still see Carolyn Lewis Elementary School (CLES) is at the edge of hearing for the sirens. I updated the radius for hearing to be 1.25 miles, after email conversations with the Asst. Director Planning and Development for the City of Conway.
I’m hoping to find a way to talk to our city leadership about this graph and see if there can be additional proposed sirens out near this elementary school.