

Quick detour from LAMA! One of the reasons I’m writing this blog is to finally process the results of our CardStock system. And sometimes that means discovering some bugs and errors. So, today I’ll talk about one of these bugs and how I’ve fixed it related to the lead history graphs.
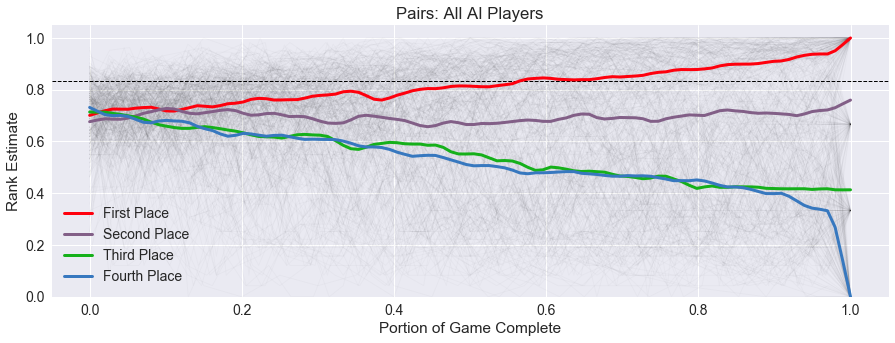
As I’ve discussed more games, I started to notice a trend in the graphs. Where I thought the initial rank estimates would average around 0.5, I was seeing values closer to 0.66. And the more I looked at the graphs, the more I noticed that they seemed to be stretched in an unusual way. The y-axis appeared compressed at the top and more open at the bottom.
For example, below is the average trend graph for Pairs. Before, when I just plotted the lead histories, I could just see points everywhere. But the average trend lines highlighted what turned out to be a tricky bug to find.
The problem turned out to be an issue with interpolation. When a simulated game is completed,
we determine the ranks of the players based on the scoring method of the RECYCLE code. For
a four-player game, these would be 1 for first place, 2 for second, etc., with a 4 being
last place. To calibrate these ranks into a value between 0 and 1, our first method
was to invert them, with the following formula:
This means the calibrated rank for first place would be 1, second place would be 0.5, third place would be 0.333, etc. All well and good.
But the problem came when averaging these calibrated ranks. Our AI players would run 10 simulations for each possible move in a game, and then find the average of their calibrated ranks across these 10 simulations.
It is easiest to see the problem in a two-player game. Suppose for a certain move, 5 of the ten simulations result in the AI player winning, while the other 5 result in the player losing. So the average calibrated rank would be:
\[\frac{5 \times 1 + 5 \times 0.5}{10} = 0.75\]I then decided I wanted to compare the games on a standard scale across games with different number of players. The inverted scale above wouldn’t work, because last place would be a different value depending on the number of players. Instead, I could flip the ranks and then scale them between 0 and 1 linearly, like this:
\[scaled\_rank = \frac{nump - rank}{nump - 1}\]With this scale, first place is always 1, and last place is always 0. For a two-player game, first place is 1, and second place is 0. And for a four-player game, first place is 1, second is 0.66, third is 0.33, and fourth is 0.
The game comparison code was in another section of the project, so instead of fixing the formula in the AI players, I thought I could just recover the original rankings by inverting the average calibrated ranks, and go from there.
What happens when you try to invert again? BAD THINGS! I would expect the recovered average rank between first and second place to be 1.5. But my formula gave me
\[recovered\_rank = \frac{1}{0.75} = 1.333\]Averaging in the inverted space is not the same as averaging in the original rank space. And when I combined this recovered rank with the scaled rank formula, instead of getting 0.5, it would return 0.66! The same fateful 0.66 I was noticing in my average trend graphs!
The solution I’ve settled on? Fixing the code in the AI player to do its comparison for selecting moves by just averaging the ranks instead of inverting them. This means both faster math, and correct results.
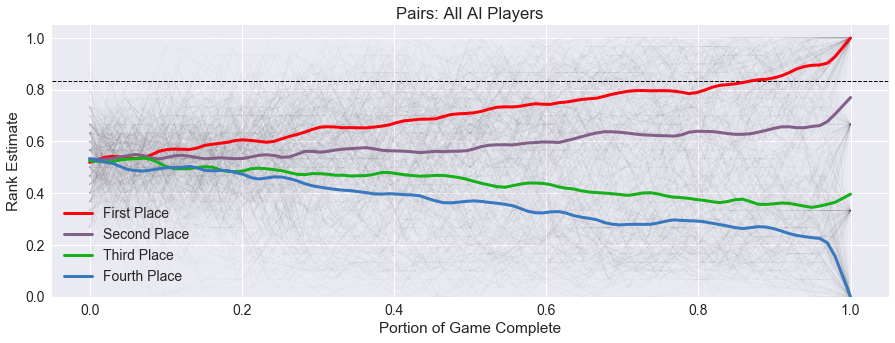
After rerunning the simulations for Pairs, we now get the following fixed average trend graph, with the starting scaled rank right there at 0.5 where I would expect.
Why did I use the invert function instead of the subtraction function in the first place?
I’ve since forgotten my motivation. I think there was some initial confusion in how
we coded up the scoring function with the min and max designations, but at this point,
I do not know. But this is a lesson for working with larger projects: leave your data raw
until you need to process it, as there might be multiple places that need the data differently.
Up Next
Thanks for bearing with the detour and the resulting bug fix!
As you might note above, recalibrating the lead histories is going to have consequences for a number of the heuristics I use to compare games, like Drama and Security. Since the drama threshold was drawn correctly but the underlying graph was not, I’m expecting the games I’ve already examined to be a little more dramatic and have less security.
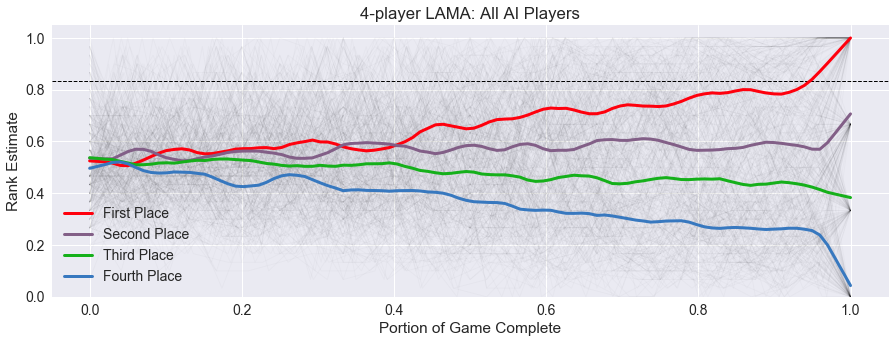
I’ve already updated all the figures and values on the summary page for the previous games, but I think it is only fair to go back and update my previous posts with new figures and discussion, since they were all based on skewed data. When that is complete, I’ll get back to my LAMA analysis, here is a preview of the upcoming data!
comments powered by Disqus