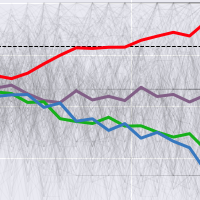

Before we get to the Hearts variants I promised, I realized I needed to spend some time thinking carefully about how to better visually compare and contrast the games I discuss. If you recall, here’s the lead history graph for Hearts that I generated for the last post.
While I think these lead history graphs are fascinating, it appears they were a bit overwhelming and messy for others. I also found it hard to clearly communicate in writing what I was seeing in them.
So, today I’m introducing a new graph, the average trend, built from averaging the lead histories for each rank.
Average Trend Graph
To make the average trend graph, first, I determined the order of players based on their final game rank. Then, for each rank, I averaged across the 100 games to find the average trend.
Here’s a graph of Hearts showing the average trend for the winning player in Hearts. Lightly in the background, I have drawn the full 100 lead histories for the first-place player, and the thick red line shows the average of the first-place lead estimates. The wild variation up and down, based on the rosy view each player takes of their own chances when selecting a move, is smoothed out in this graph.
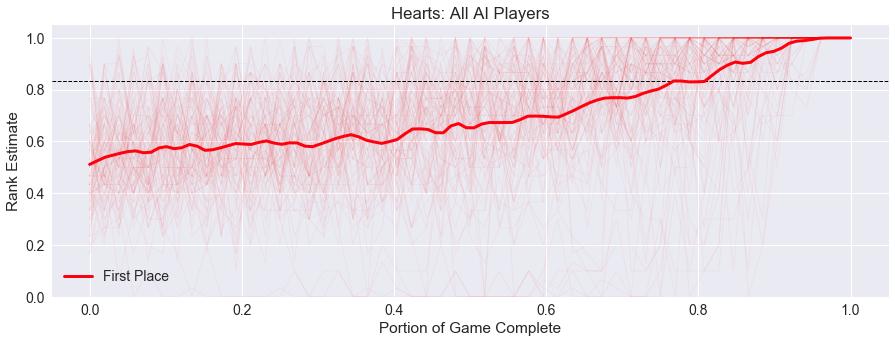
We can also see some interesting subtleties in this graph that were missed before. The small plateau jumps toward the end of the game, those correspond to the lead player’s turn for the last 4-5 tricks of the game. So, it looks like the winning player is more likely to be the lead player near the end of the game, especially when they are following the Shoot the Moon strategy! And while each individual graph varies, we can say now that on average the winner knows they will win after 3/4 of the game has been played.
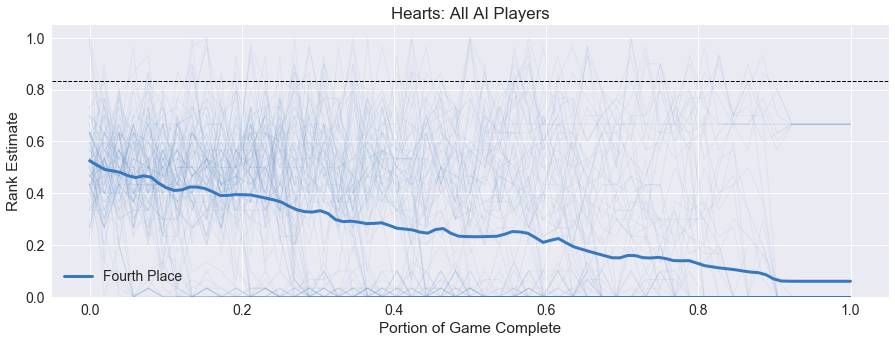
Similarly, we can graph the average trend for the losing player, as shown in blue below for the fourth-place average trend graph. Note that their final average at the end of the game is not 0, total loss, since there are games when they might be tied with another player, such that two players earn 13 points. Or, when the winner shoots the moon, the other players will tie for second.
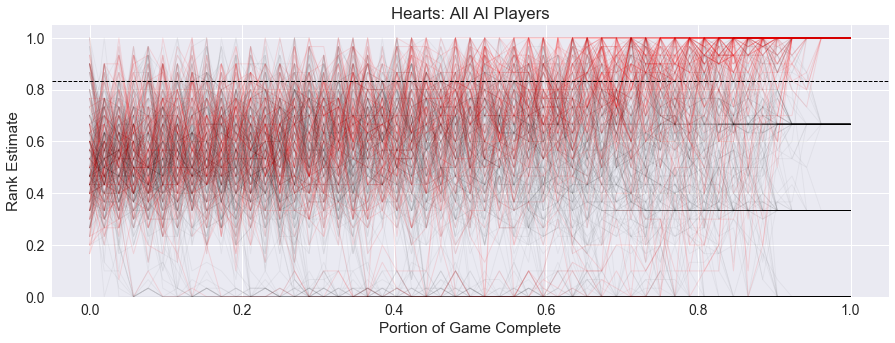
The graph below shows the average trends for the aggregate lead histories in Hearts. When we put them all together, I think it is easier to follow the game flow for each player.
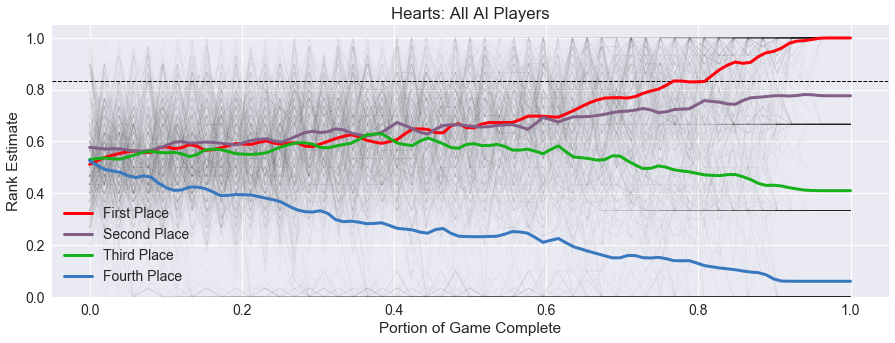
We can quickly see that the fourth-place player drops off right away. By the end of the 3rd trick, this fourth-place player will probably have a sense that they are losing the game, while the rank estimates of the other three players stay tightly clumped until about half-way through. It also looks like the second-place player is likely to tie with the winner about 40% of the time!
New Insights on Old Games
We can’t let Hearts have all the fun though! Let’s go back and look at each of the games we previously analyzed and see if anything new pops out.
Agram
First up, we see below the average trend for Agram, our super-simple trick-taking game where the winner of the last trick wins the game.
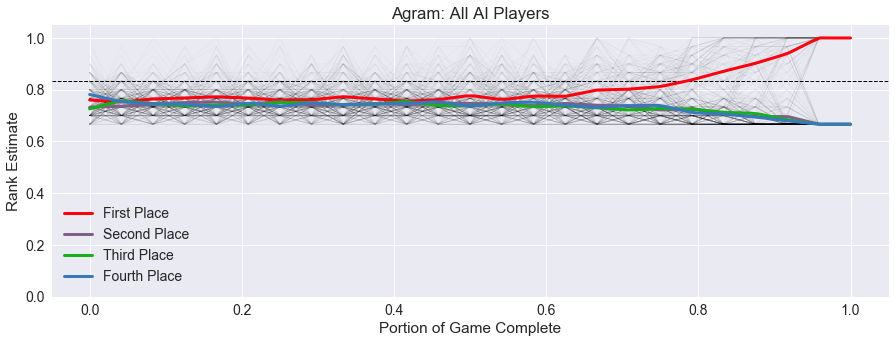
With just 6 tricks in the whole game, there’s little time to have strategy in Agram, but this new graph shows us one piece I missed before. There is a increase in the winning trend at the start of the 4th trick! This uptick repeats at the start of the 5th trick, and continues on for the final trick. This says that there is an advantage to being in the lead near the end of the game, so you can have better control as you try to win the final trick.
Pairs
For Pairs, a quick press-your-luck game, we previously saw a trend of the winner of slowly increasing their chances, but weren’t sure about the other players. Below is the new average trend graph for Pairs.
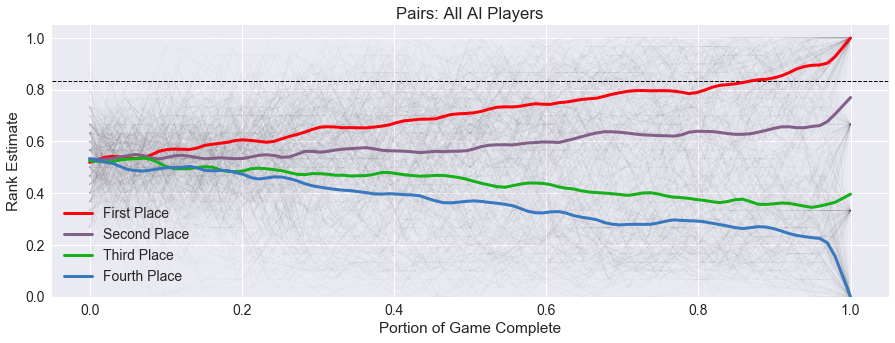
We can still see the clear slow increase of the winner, but look below! Wow! The third and fourth-place players are close for much of the game, only diverging at the very end, usually on the last move of the game! This may not be a tense game for the winning player, but for the losing player, there are some very critical estimates and decisions needed for success.
Ninety Eight
Our third game was NinetyEight, an adding game with straightforward card play. The average trend graph below confirms what we saw earlier, that most players in the game feel very secure that they will be winning the game.
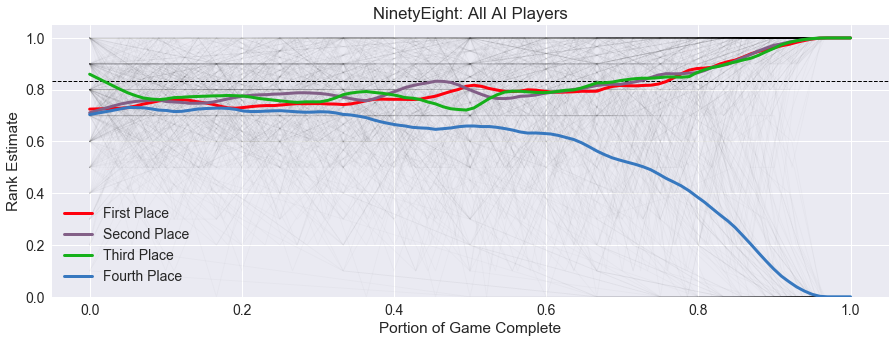
The losing player slowly diverges, but then about half-way through the game, there is a steep decline. But since we don’t know how long the game will take in advance, there is little the losing player can do to anticipate this sudden turn of events, namely a King being placed on the pile and setting the score precariously to 98.
In the No King variant of Ninety-Eight, the average trend graph for all players is very steady for much of the game, as the pile slowly ticks toward 98.
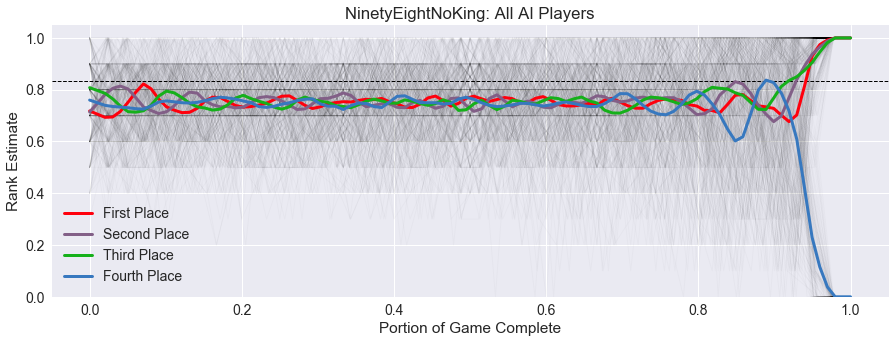
Near the end of the game, there is a weird fluctuation of graphs which captures something interesting. The losing player’s graph, dips, then recovers briefly, then dips completely down to 0. This is most likely a reflection that there are some cards that can bring the pile total back down from 98 once crossed, but their benefit is short-lived.
Stealing Bundles
Finally, we revisit Stealing Bundles, a fishing game with simple scoring and matching, but with the potential for large point swings.
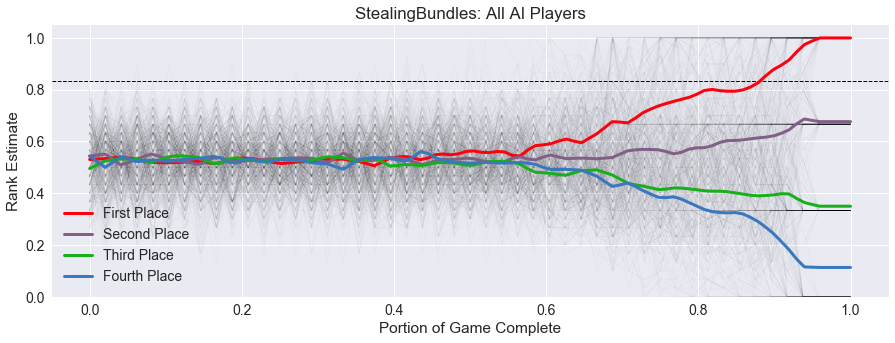
Previously, it looked as if the ranks became clear for everyone once the final hand was dealt, however, the average trend graph tells a slightly different story. Players now appear to differentiate one by one, first with the winner, then with second place, etc.
Up Next - Hearts Variants
Hopefully you found this new visualization helpful and as fascinating as I did. I’ve also updated all of these graphs on the Summary page. Let me know if there’s insights you made that I missed in the comments below.
Now, time for some Hearts variants, to see the effects of small and large rule changes!
comments powered by Disqus